Watching cells blend into a dull blur nearly pushed me over the edge. Adding a splash of strategic highlighting changed everything. Conditional formatting makes my numbers pop out just right, and I’ve never felt more in control of my spreadsheets.
6
Spot Duplicates
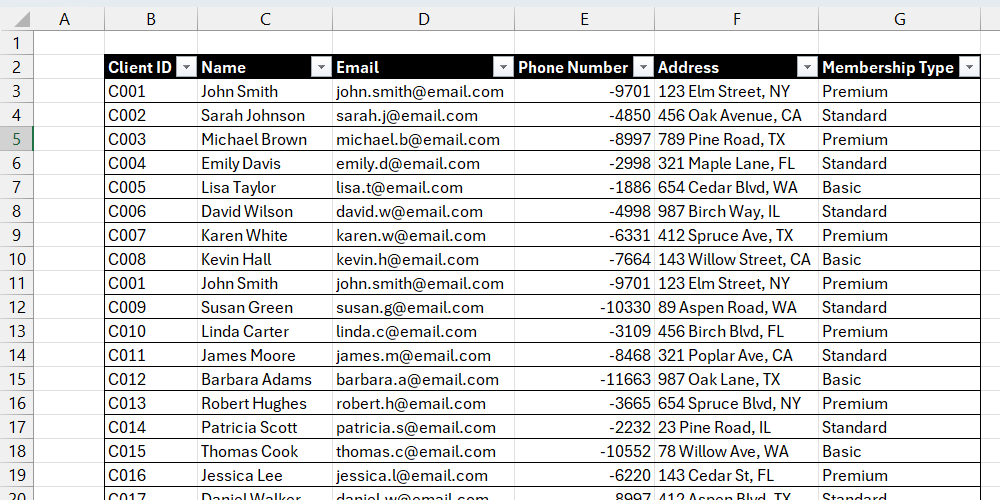
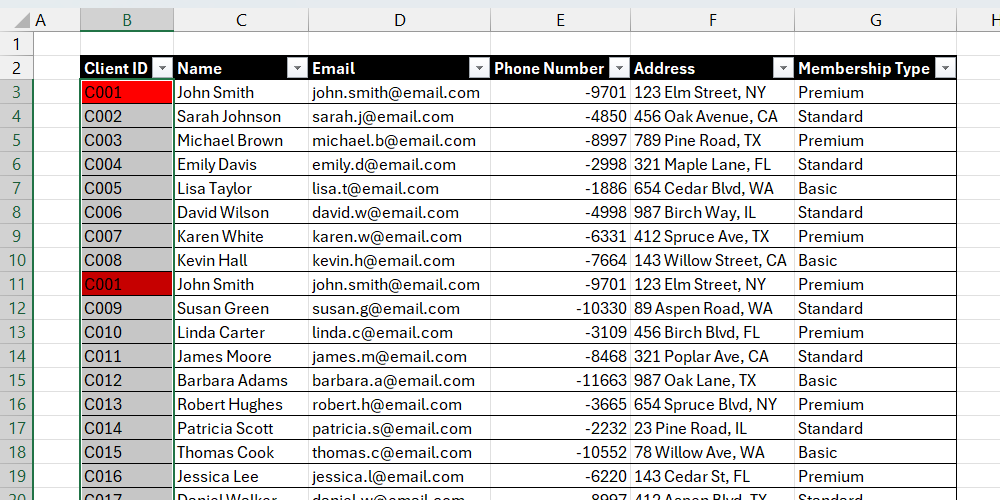
Say you’re looking at a list of names with dozens of entries, and you need to find which names are repeated. It can be maddening to go through that list individually, trying to find the duplicates, especially if you have more than one list to review. Furthermore, since you are human, there is a chance that you might miss a few, which can be a critical mistake in some scenarios.
To make duplicates instantly recognizable on your Excel sheet, you can use the Format only unique or duplicate value and set a fill color (e.g., red or green) to highlight the repeated data.

Related
8 Little-Known Excel Functions That Can Save You Tons of Work
Your Excel game is about to go pro with these sneaky shortcuts.
5
Detect Blank Cells
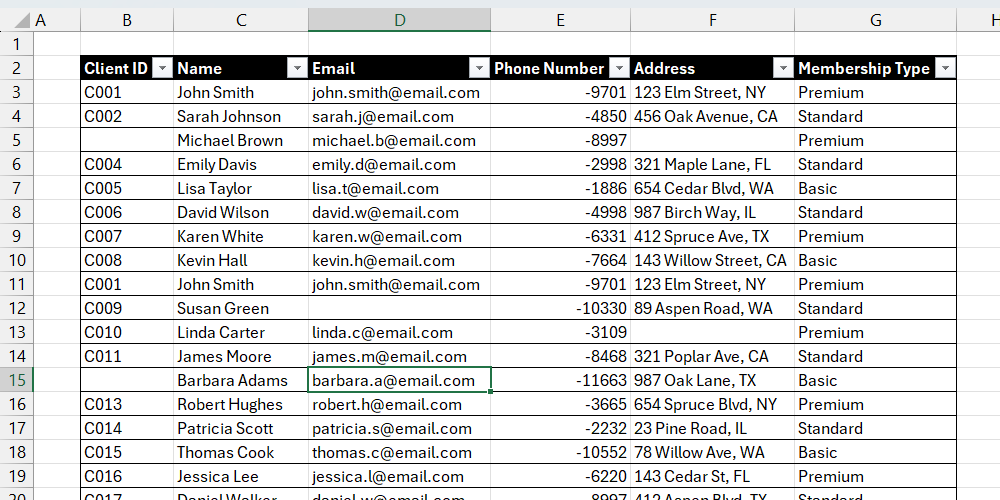
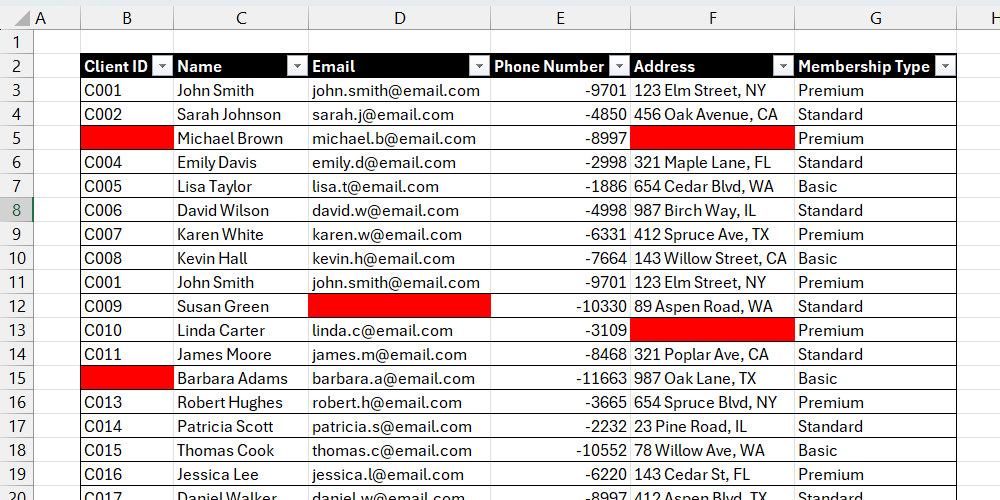
Similar to checking for duplicates, checking for blank cells in a large Excel sheet can be time-consuming and error-prone. You simply cannot rely on your brain alone since it can sometimes fill in the blanks, especially if you check quickly. After spotting the blank cells, the Excel sheet becomes easier to fix because now you know where input is needed.
Luckily, Excel has a conditional formatting trick that allows you to check for blanks automatically. All you have to do is use the Format only cells that contain conditional formatting to find the blanks, along with a fill color to highlight the blank cells.
4
Check for Errors
Imagine you’re checking a sheet, and you find errors such as #N/A, #NAME?, #REF!, #VALUE!, or #DIV/0!. These indicate that there is a problem with a formula or function. The result is that calculations will not work as expected, and you may not be able to finish your task.
In scenarios where there are many errors, you can use conditional formatting to highlight them all with a few clicks. You just need to create a rule that applies ISERROR Excel function to the range in question.
3
Task Management
You can use conditional formatting for task management scenarios in Excel, but the most common application for me is highlighting overdue tasks. This allows me to quickly spot tasks that need attention in my spreadsheets so I can complete them or contact the assignee.
This is as simple as using a rule that checks if the date in the Due Date column is less than today. You can achieve this using the TODAY and IF functions in a conditional formatting rule and then applying a red fill.
Another example is applying a highlight to tasks based on their priority—high (red), medium (yellow), and low (blue). But if I don’t want to light up my Excel sheet, I usually just use Excel’s sorting feature to organize the tasks by priority.

Related
10 Powerful Excel Project Management Templates for Tracking Anything
Want Microsoft Excel to manage your projects? Use these free Microsoft Excel spreadsheet templates for tracking any project!
2
Budget Monitoring
I track both my personal and household budgets in Excel, but before I decided to add some conditional formatting, I often wondered why I couldn’t stay on top of my spending. For example, I’d miss when an expense, such as dining out or entertaining, exceeded my budget.
By setting up rules, I can highlight expenses that exceed a specific threshold, such as turning cells red when they surpass my planned amount. This visual cue instantly flags overspending, letting me adjust my finances on the spot.
Conditional formatting can also help track expenses with deadlines. You can create a rule that highlights an expense when its due date is fast approaching or overdue.

Related
How to Create a Budget in Excel and Understand Your Spending
New to budgeting? Here’s how to make a budget in Excel the right way.
1
Quickly Spot Trends and Patterns
It’s not uncommon to come across large datasets in Excel, making it a challenge to identify trends or patterns just by looking at the numbers. With conditional formatting, you can easily apply color scales, data bars, or icon sets to your data, making it easier to gain the insights you need.
Suppose you’re analyzing sales performance across different regions. A color scale, which you can apply with a few clicks, can help you create a heat map that shows you which areas are performing well (green) versus those that need attention (red).
We have all been in scenarios where we want to rage-quit an Excel sheet because we can’t easily make sense of the data. But Excel wouldn’t be the great spreadsheet program it is if it couldn’t save your sanity a little. As you can see, it’s not hard to use conditional formatting to get over what is blocking you from completing a task in Excel.

